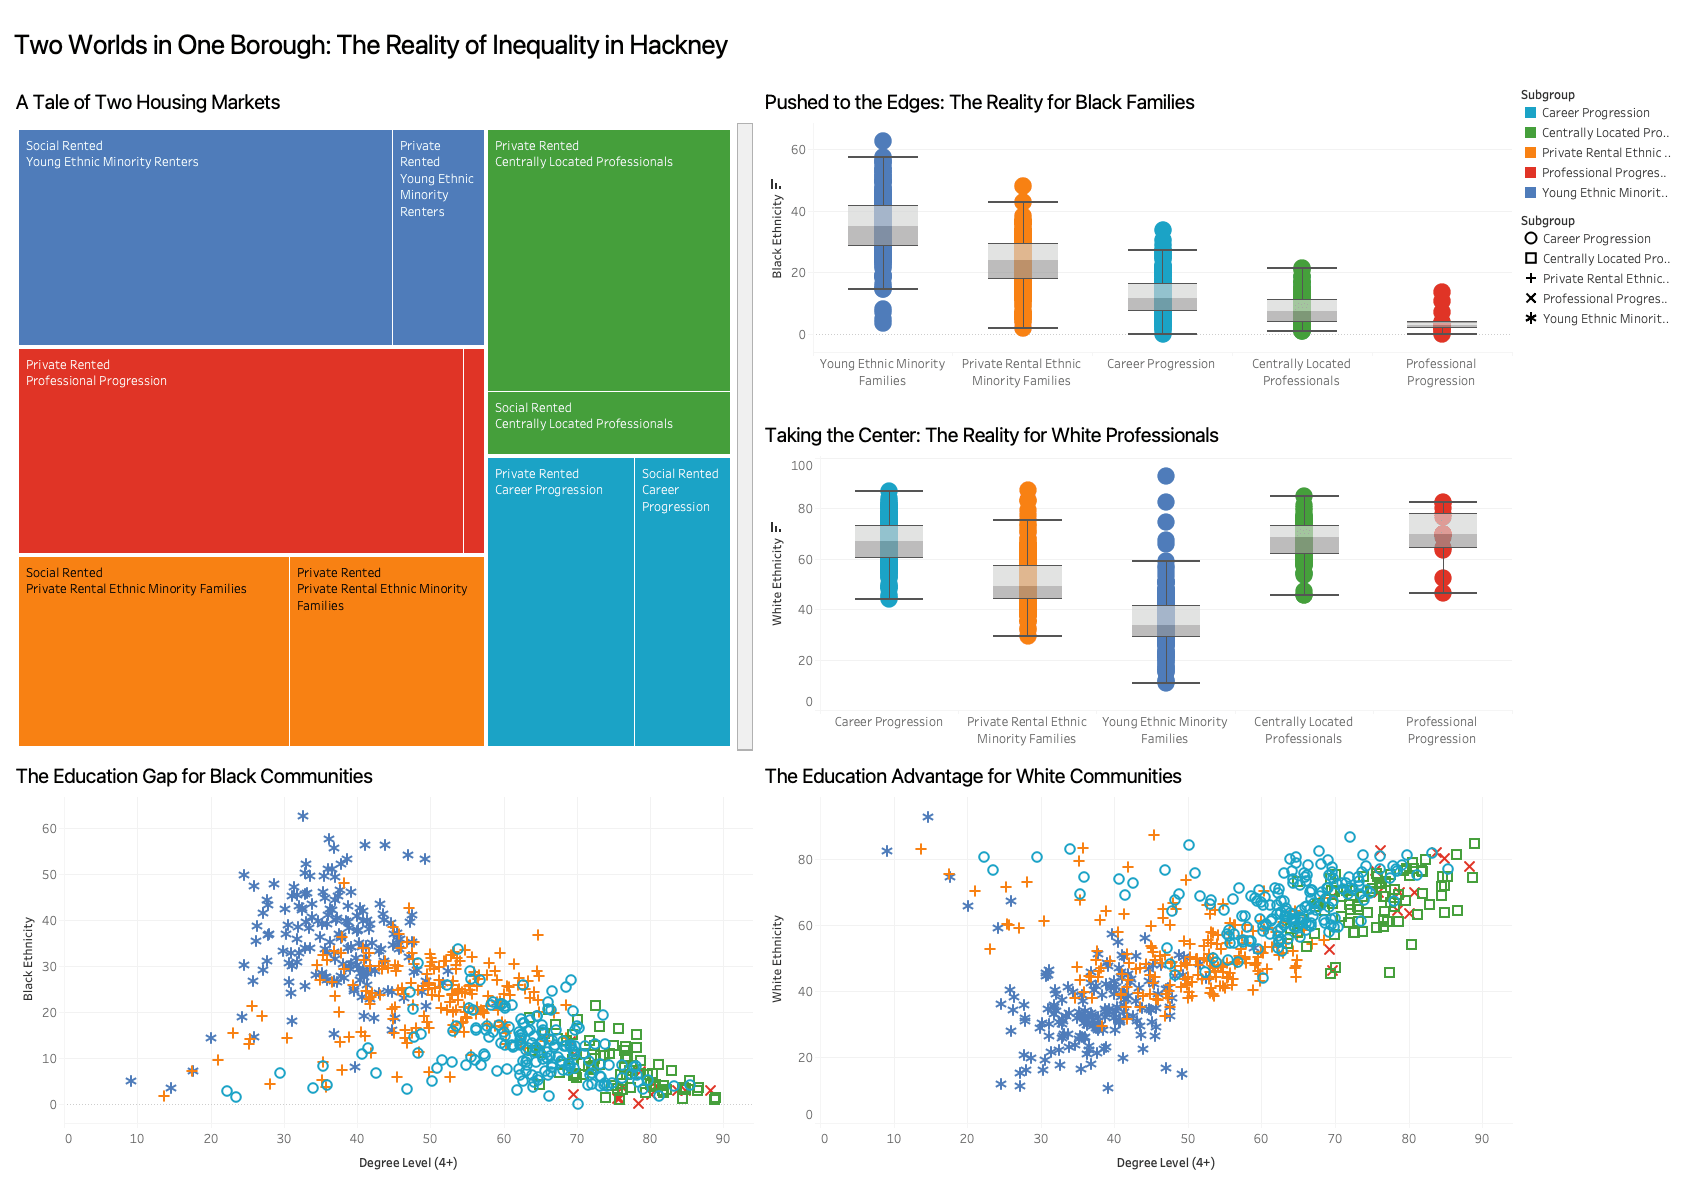
A3-format magazine-style dashboard mapping housing tenure, race and educational attainment across London. Combined macro-level treemaps, box plots and un-aggregated scatter plots to expose structural inequalities. Applied Grammar of Graphics principles to encode categorical data with unified visual variables and a single legend, cutting cognitive load for a public audience.