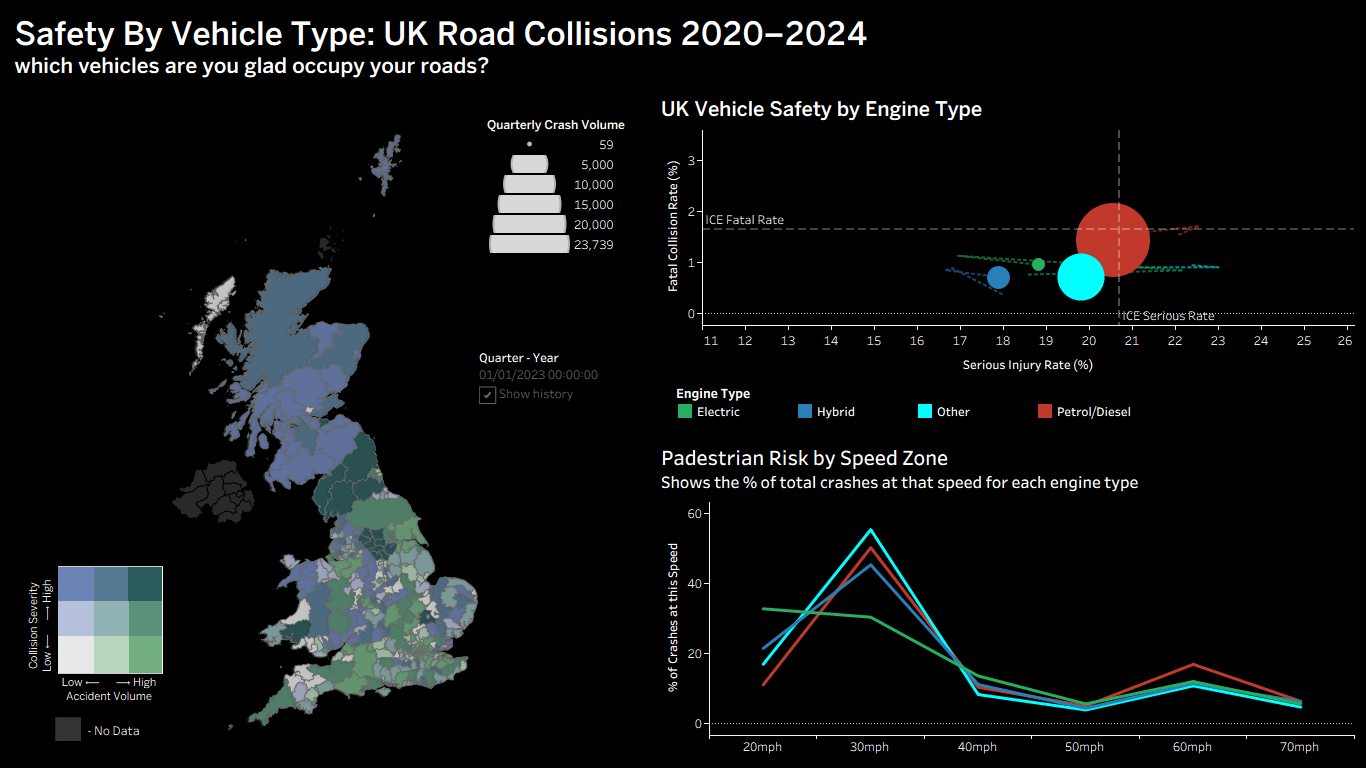
Fully interactive dashboard over 503,000+ collision and 920,000+ vehicle records comparing the spatial and temporal safety profiles of electric and internal-combustion vehicles. Built a 3×3 bivariate choropleth, a 100% normalised speed-zone line chart, and an animated 20-quarter time-series with motion trails. Handled inner joins, LOD expressions, window percentiles and null-handling logic to keep the dashboard stable under multi-layered geographic cross-filtering. Found that EVs carry a 42% lower overall fatality rate, but 72% of their severe collisions concentrate in 20–30mph urban pedestrian zones, a clear policy target.